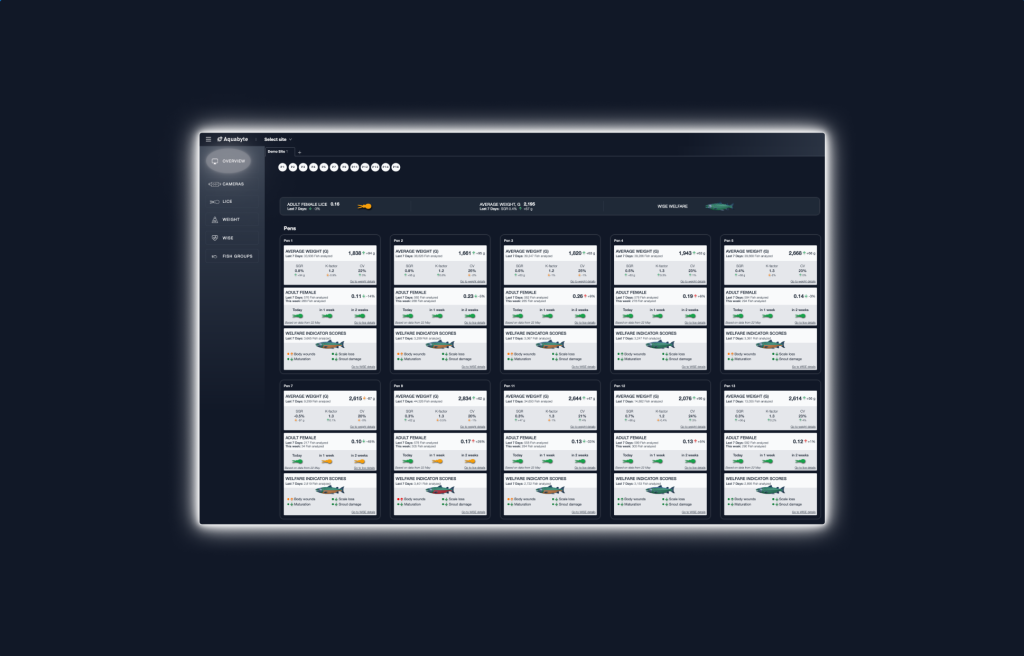
We have gathered the most important information from all the pens in one place. This means faster and easier access to data for you, as well as providing you with a clear tool to help you make the right decisions at the right time.

Key figures for the entire site
OVERVIEW provides you with key figures for the entire site in one place. Average lice counts, weight data, and welfare indicators for all the pens are displayed in a separate section, allowing you to quickly see the status of the entire facility at a glance. If you only want key figures for a selection of pens, you can remove those you do not wish to include in the calculation. This way, only the selected pens will be included.
The most important data for each pen
OVERVIEW has individual cards with the most important information from each pen. Here, you will find average weight, growth development, SGR, and K-factor. On the same card, you can see today’s lice count, lice trend, and lice forecasts for one and two weeks ahead. At the bottom of each card, the welfare status of the pen is displayed, with selected welfare indicators indicated by green, yellow, or red depending on the condition. This makes it easier to get an overview and see what needs to be addressed first.
Easier to compare pens
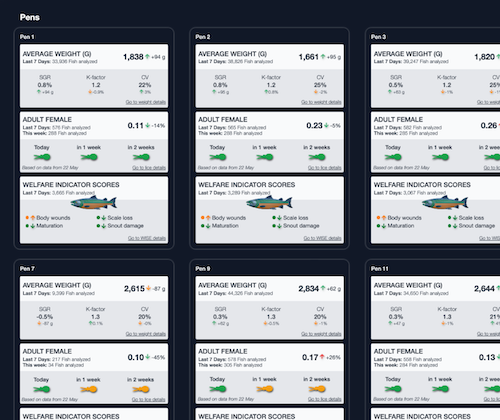
With one card per pen, OVERVIEW makes it easy to compare: What are the lice counts for the different pens? Which one has the highest average weight? Is there a difference in fish welfare between the pens? Good overview is important for planning the right measures at the site level and identifying pens where spot treatments are needed.
OVERVIEW as a planning tool
The key figures displayed in OVERVIEW change depending on which pens are selected. You can use this function to see the effects of various measures: What happens if pen 3 is harvested before pen 8? Which pen should be deloused first to achieve the greatest effect? When you temporarily deactivate and remove one or more pens in OVERVIEW, you immediately see the consequences this has for the entire site.
Better decision-making processes
Easier and faster access to important information and data facilitate better decision-making processes. Information can be shared more effectively within the company, and with one consolidated overview, you and your colleagues can make important decisions based on shared information and foundation. Better overview leads to better decisions.