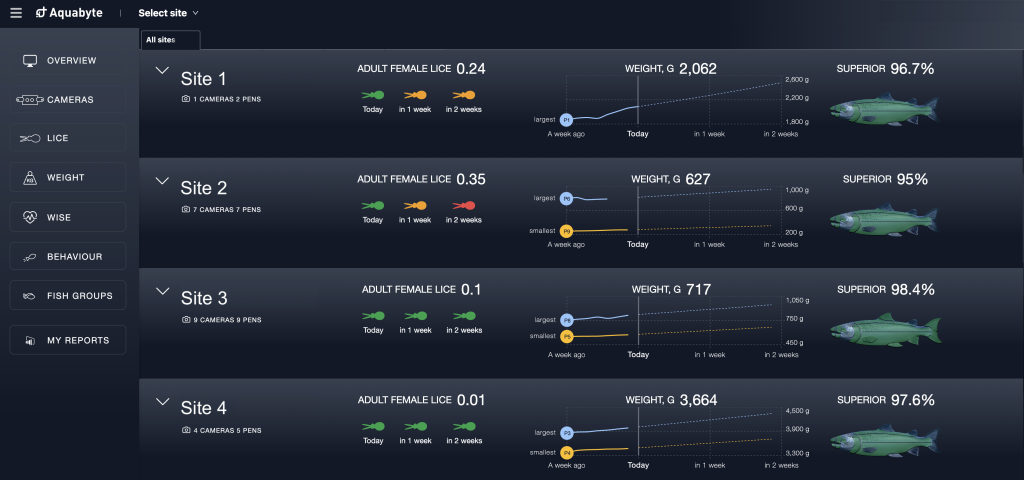
We know that many of you work with multiple sites. That’s why we’ve upgraded the OVERVIEW in the User Portal, allowing you to see the status of all the sites you have access to in one place. You can quickly view key data for each site and immediately identify those needing extra attention. The new view saves you time and clicks, while also streamlining the planning and implementation of necessary actions.
View key data from multiple sites
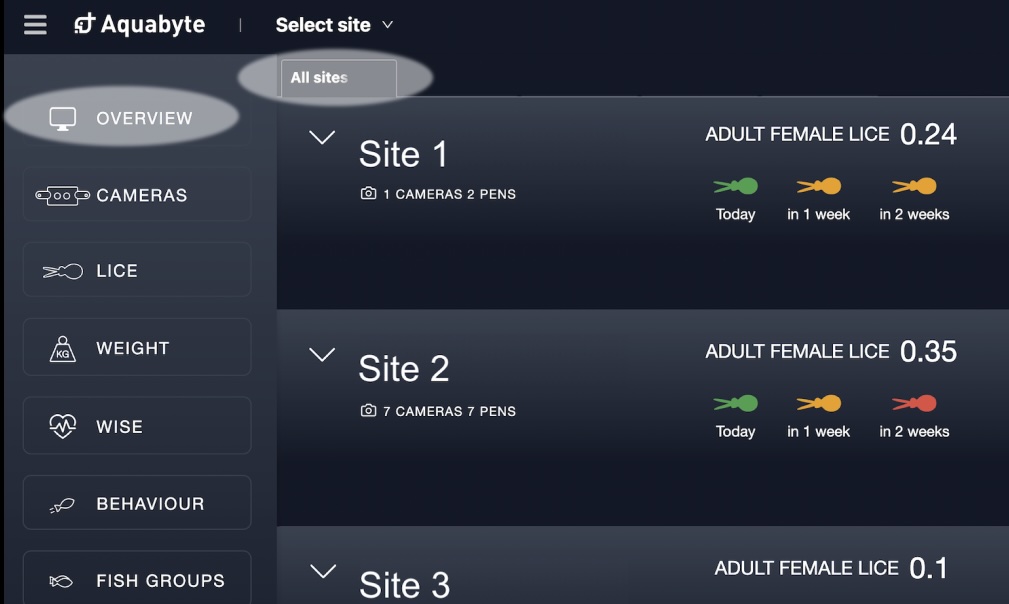
- Select OVERVIEW from the main menu
- Select the new ALL SITES tab
- Key data for the sites is displayed as a list
- Click on a location name in the list to view the status of each individual pen
This is displayed in the site overview

The key data displayed in the new overview are aggregated average values for all pens at the site. The following data are available:
Lice status with two-week prediction
Weight data showing the average weight for the entire site, the average weight for the pens with the largest and smallest fish, and a two-week growth prediction
- Superior rate
Exclude pens from average data calculations
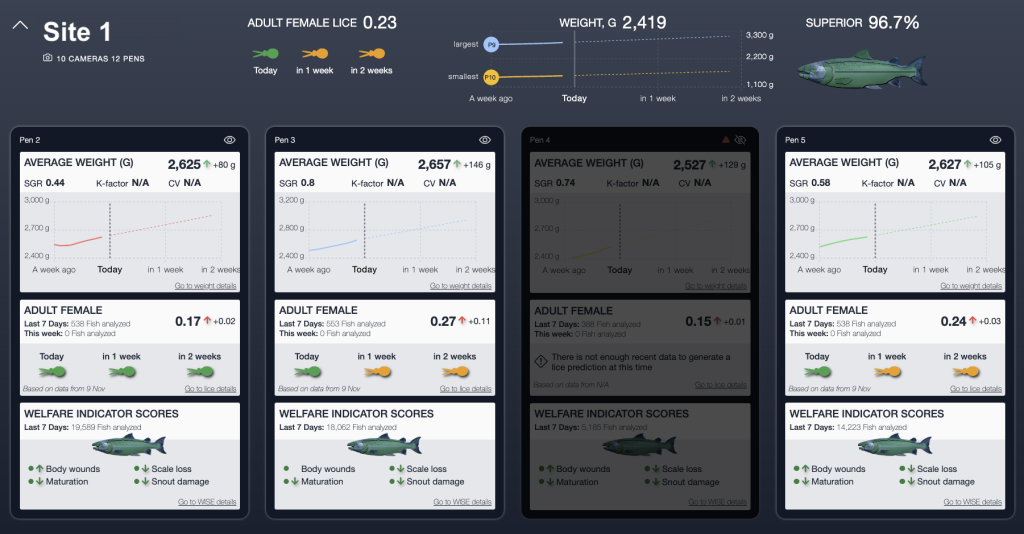
If harvest, delousing, or other measures are planned for certain pens, you can remove them so they are not included in the average data calculated in the location overview. Here’s how:
- Click on the site name in the list to view the data cards for each individual pen
- Click on the eye symbol in the top right corner of the data card for the pen you wish to exclude
- The average data for the entire location is updated immediately.
Use the main menu to view detailed data
If you wish to view detailed data at the pen level for WEIGHT, LICE, WELFARE, and BEHAVIOR, you can find them the same way as before:
- Select site in the top tab menu
- Use the main menu on the left to view graphs and detailed data as usual
We hope the new overview simplifies and enhances your daily workflow. If you have any questions or feedback, please don’t hesitate to reach out to our Customer Support team.


